
Introducing Carebot
You may have heard about Carebot in the media and you may have talked to us about the technical aspects of what it could be, so here is a quick update about what Carebot is today and where things stand.
What is Carebot for?
I started describing Carebot as “meaningful analytics for journalism” when I noticed that the conversation about success in journalism always turns to what data people are looking at and what tools they are using rather than what problem it seeks to address and why.
We are not creating Carebot because there is a shortage of analytics tools or even a shortage of interest in analytics in journalism (at this point, there is great interest and tools abound). There is, however, a misalignment between the day-to-day of newsrooms and the level of insight journalists want and need about the performance of their work once it’s out in the world.
Carebot’s objective is to better align analytics for newsrooms to the reality of the journalists working in these diverse settings. That requires building a tool to deliver information but it also requires understanding the workflow and needs of the journalist, acknowledging that there are a variety of storytelling devices that can be employed in their work, and developing metrics that best align all these characteristics.

Analytics are collections of data points; in order to be meaningful they need to be contextualized and relevant to the circumstances in which they are presented. What makes analytics particularly meaningful (as opposed to a handful of generic tracked data regurgitated from a database into a dashboard or report), is how well it drives people to act, whether to tweak a story, celebrate their success or make decisions about subsequent work.
The drive behind Carebot is a set of hypotheses. Our project is a prototype for the approach we believe can help us test and explore these hypotheses and understand how things play out in the real world of day-to-day journalism. We are exploring a few different facets:
-
New thinking around what newsroom analytics should be. This includes what we measure (what’s ‘a story’ and what it can be compared to - or not), and how we are measuring (which measures and indicators make sense for what questions, and which ones are NOT appropriate, or misleading, or deceiving).
-
The technical implementation and adoption of those analytics. This concerns how we are measuring (the technical approach to tracking, analyzing and reporting) and when and where we are helping journalists become aware of these insights (the content, framing, frequency, volume and scope of information shared).
Since Carebot is first an experiment, the way it works today may be completely different from how it will work in six months, but the premise is always of continuously exploring newsroom analytics and appropriate implementation fitting with newsroom circumstances.
How does Carebot work?
The mechanics of Carebot are extremely straightforward: Ze collects usage data on live stories and reports specific metrics as notifications to the newsroom over a finite period of time. In our current phase of experimentation, here’s how it’s done:
For every story, Carebot uses a tracking component (a little snippet of code) which captures a few different aspects of how users are accessing and interacting with a story.
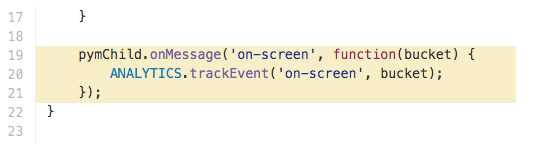 example tracking of on-screen visibility for graphics
This information is fed into Google Analytics (as events and event categories, if that lingo matters to you). Carebot is also tracking some aspects of usage for things more granular than a story, such as graphics and images (which can be interesting in an of themselves).
This is not unlike any other measuring and tracking approach on the web, with the exception that we are intentionally focusing on a very narrow and specific set of measures — measures and indicators we are developing and testing to understand their relevance and usefulness to decision-making in the newsroom (more on that in a later post).
Newsrooms are busy places, so after aggregating this data, Carebot does two things differently from other reporting tools:
a) it only surfaces metrics identified as possibly most useful in understanding story performance for a given story type and
b) it offers this information through periodic notifications over a finite period of time, following the usual traffic pattern for a story.
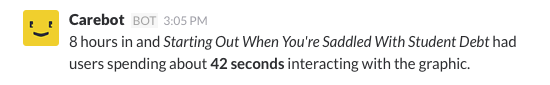 a notification about the graphic on-screen visibility for a story
Currently the notifications are being delivered via Slack in a channel used by a specific desk (our Graphics desk) because we are prototyping Carebot in a newsroom where this particular technology is in use. Carebot is agnostic to the delivery method and the notification would work just as well as a text message, an email, a mobile app, or as a bot integration on other services like Hipchat or Twitter.
When Carebot first becomes aware of a story (the story gets published and the tracking mechanism starts gathering data from user visits), it alerts the newsroom so they know Carebot is keeping track of things and will start sending relevant notifications over the course of the next 3 days (3 days only due to the current scope of our work):
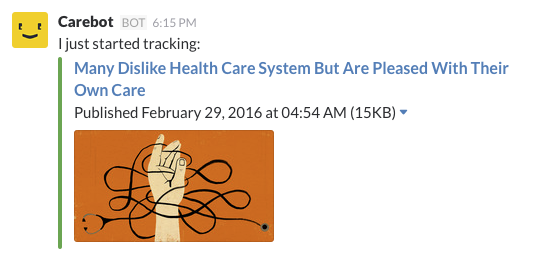 first notification carebot shares about a story
The scope of our current experiment is only stories with graphics and the metric we are testing is an indicator we call the “linger rate”, to assess how much time users are spending with the graphic, not just the time they spend with story the graphic is in.
After the first notification to indicate tracking has begun, Carebot reports that metric for the story every 4 hours for the first day, then twice daily for the second and third day. This frequency and volume are part of our experiment to find a good balance of awareness without nagging.
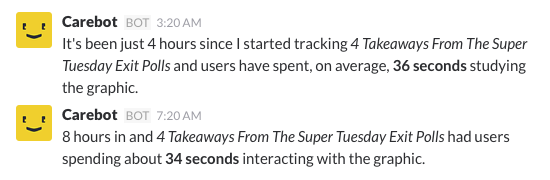 example of wording variation used on 2nd and 3rd notifications
Some stories contain multiple graphics or graphics may be used across different stories. These unique scenarios are helping us explore different presentation needs and how to best answer questions raised by journalists when the right metric is available at the right time.
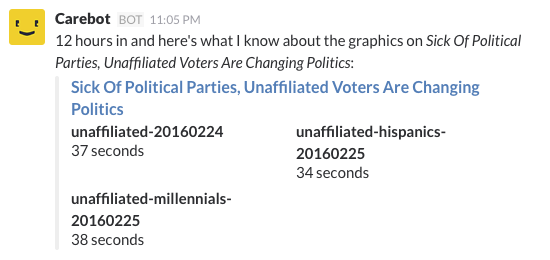 early example for a story with multiple graphics
Carebot is currently a broadcasting tool more than it is a bot that responds to specific user requests, but we are beginning to add a few capabilities based on user feedback and what we are learning as they receive information from Carebot.
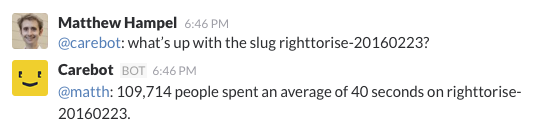 test query for specific graphic information
What’s next for Carebot?
We have been developing Carebot for just four weeks and in this short time have seen great potential from the questions designing it has raised, as well as from user feedback. We are working on 2-3 week cycles where we increase Carebot capability by growing scope of stories we analyze, scope of metrics we develop and track and report, and scope of features we develop.
Our work is currently supported by a Knight Foundation Prototype Grant through May 2016. In this time, our goal is to have a concrete set of metrics (well articulated and documented), with a functional tracking and reporting mechanism (Slack notifications for now) being used in a live newsroom setting (NPR), actively helping the work of journalists (Visuals’ desks).
This will help us demonstrate the potential of Carebot’s approach and share the lessons we learn over the course of experimenting with this notification based approach and new metrics to improve understanding and assessment of performance for journalism.
Note: The Carebot team will be at NICAR 2016, March 9-13, and more than eager to talk to anyone interested in understanding performance and analytics for journalism. Please connect with us in person (there will be a session about this very topic in the conversation track!) and online through @thecarebot. You can follow our progress on Github.